Welcome to the US Beekeeping Survey App
Explore honey bee colony loss and management data collected by the US Beekeeping Survey.
Thanks for visiting the US Beekeeping Survey Application! This interactive app displays honey bee colony losses and Varroa management practices reported by beekeepers in the US. Users can apply filters, including survey year, season (annual, summer, winter), state/territory, and operation type (backyard, sideliner, commercial) to update the visualizations. Depending on the selected question, the chart may be shown as a bar chart, line chart, or histogram. A download button, as well as an accessible data table with the full underlying dataset, is available for each chart.
Click the tabs at the top or the cards below to start exploring the app.
To learn about the survey: https://aub.ie/us-beekeeping-survey
To submit feedback or report issues: https://aub.ie/us-beekeeping-survey-feedback
The information included in this App is not an endorsement of a beekeeping practice, product, or active ingredient.
To cite information visualized by the App, use: US Beekeeping Survey, https://aub.ie/us-beekeeping-survey-app
Data source: US Beekeeping Survey
Data curation: N Steinhauer, Z Beneduci, A Giacobino
App designed by: Z Beneduci, A Giacobino, N Steinhauer, G Williams
Last updated 31 March 2026
To cite information visualized by the App, use: US Beekeeping Survey, https://aub.ie/us-beekeeping-survey-app
Data source: US Beekeeping Survey
Data curation: N Steinhauer, Z Beneduci, A Giacobino
App designed by: Z Beneduci, A Giacobino, N Steinhauer, G Williams
Last updated 31 March 2026

© US Beekeeping Survey
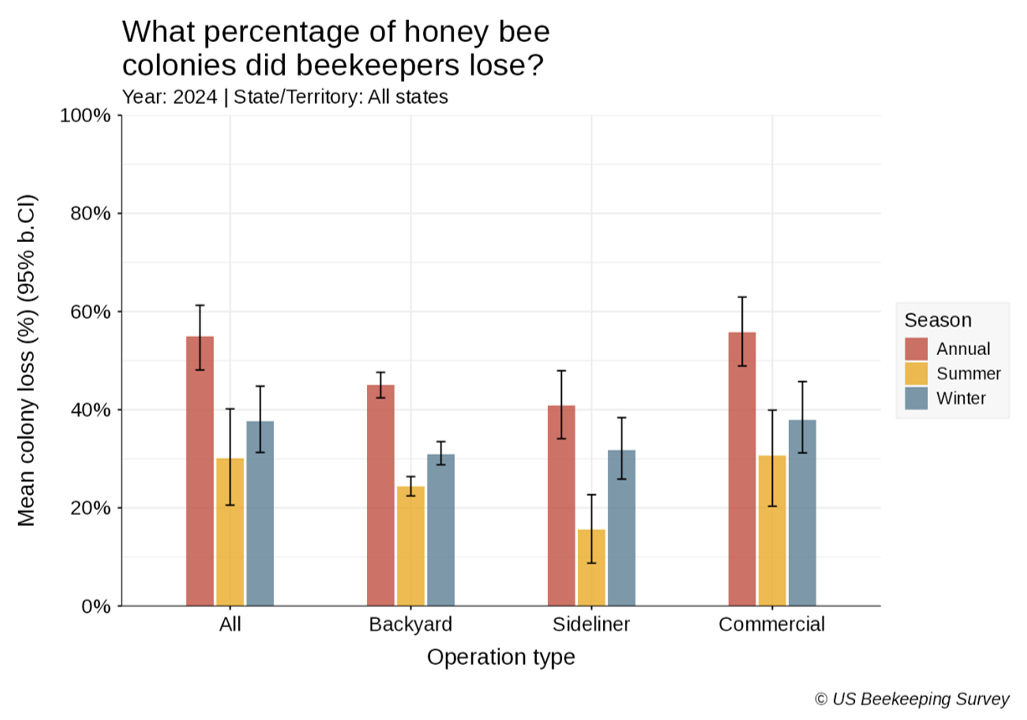
Click the above sub-tabs to navigate within 'Colony Loss'. Use the dropdowns/checkboxes below to filter data.
See 'Data Table' below for definitions.
Click the above sub-tabs to navigate within 'Percieved Causes'. Use the dropdowns/checkboxes below to filter data.
See 'Data Table' below for definitions.
Click the above sub-tabs to navigate within 'Trends'. Use the dropdowns/checkboxes below to filter data.
See 'Data Table' below for definitions.
The information included in this App is not an endorsement of a beekeeping practice, product, or active ingredient.
To cite information visualized by the App, use: US Beekeeping Survey, https://aub.ie/us-beekeeping-survey-app
Data source: US Beekeeping Survey
Data curation: N Steinhauer, Z Beneduci, A Giacobino
App designed by: Z Beneduci, A Giacobino, N Steinhauer, G Williams
Last updated 31 March 2026
To cite information visualized by the App, use: US Beekeeping Survey, https://aub.ie/us-beekeeping-survey-app
Data source: US Beekeeping Survey
Data curation: N Steinhauer, Z Beneduci, A Giacobino
App designed by: Z Beneduci, A Giacobino, N Steinhauer, G Williams
Last updated 31 March 2026
© US Beekeeping Survey
Click the above sub-tabs to navigate within 'Explorer'. Use the dropdowns/checkboxes below to filter data.
See 'Data Table' below for definitions.
Click the above sub-tabs to navigate within 'Triggers'. Use the dropdowns/checkboxes below to filter data.
See 'Data Table' below for definitions.
Click the above sub-tabs to navigate within 'Trends'. Use the dropdowns/checkboxes below to filter data.
See 'Data Table' below for definitions.
The information included in this App is not an endorsement of a beekeeping practice, product, or active ingredient.
To cite information visualized by the App, use: US Beekeeping Survey, https://aub.ie/us-beekeeping-survey-app
Data source: US Beekeeping Survey
Data curation: N Steinhauer, Z Beneduci, A Giacobino
App designed by: Z Beneduci, A Giacobino, N Steinhauer, G Williams
Last updated 31 March 2026
To cite information visualized by the App, use: US Beekeeping Survey, https://aub.ie/us-beekeeping-survey-app
Data source: US Beekeeping Survey
Data curation: N Steinhauer, Z Beneduci, A Giacobino
App designed by: Z Beneduci, A Giacobino, N Steinhauer, G Williams
Last updated 31 March 2026
© US Beekeeping Survey